
Last updated September 23, 2026
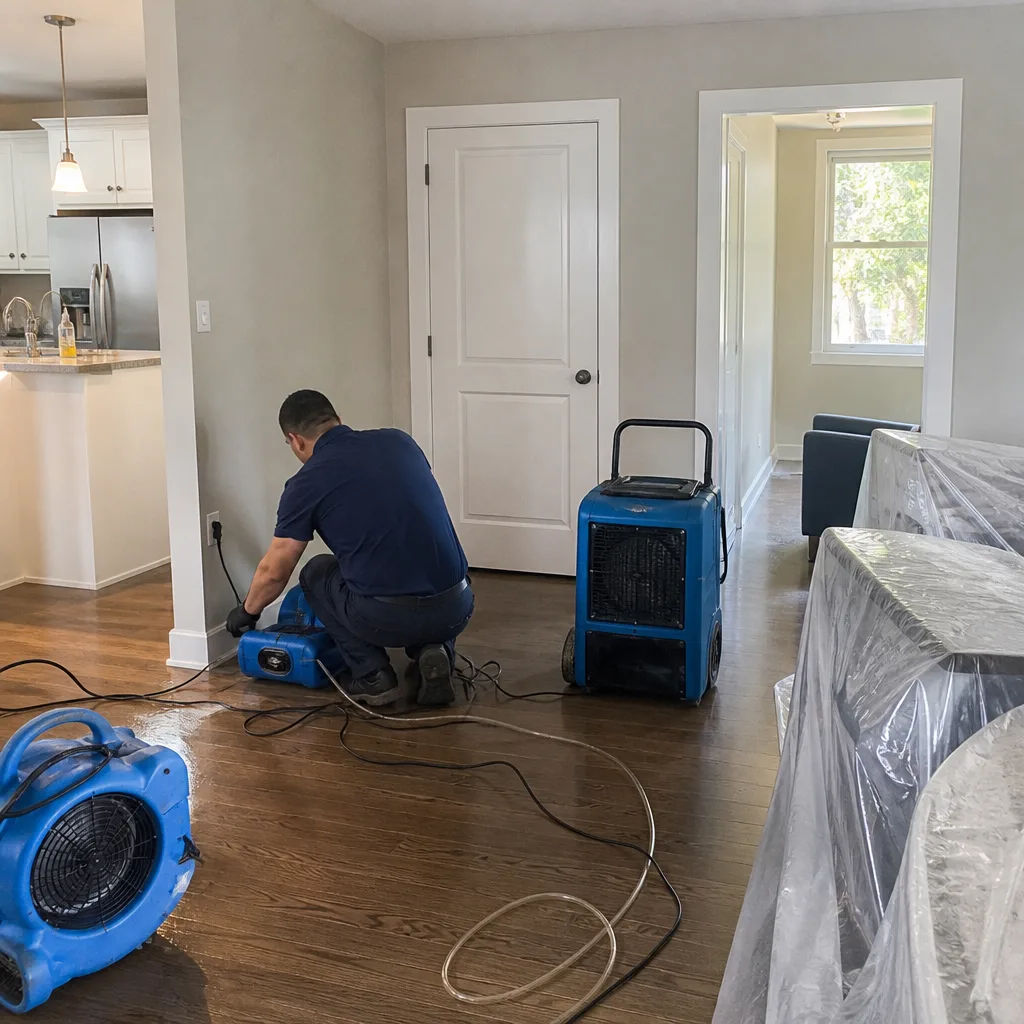
Free visual inspection and a written scope of work before any mitigation begins - photos, moisture readings, and drying logs go in your claim file
The scope we write is the scope we bill. Anything new gets shown to you, in writing, before we touch it.
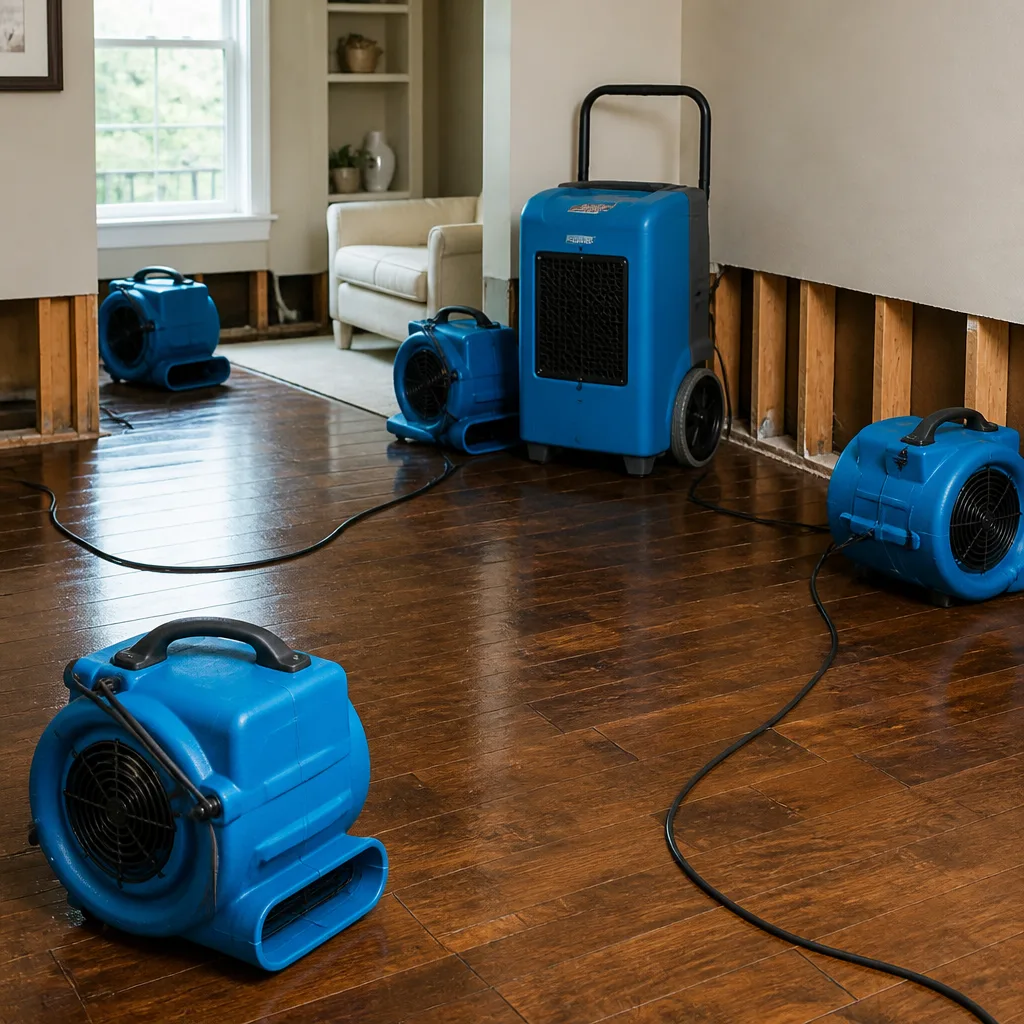

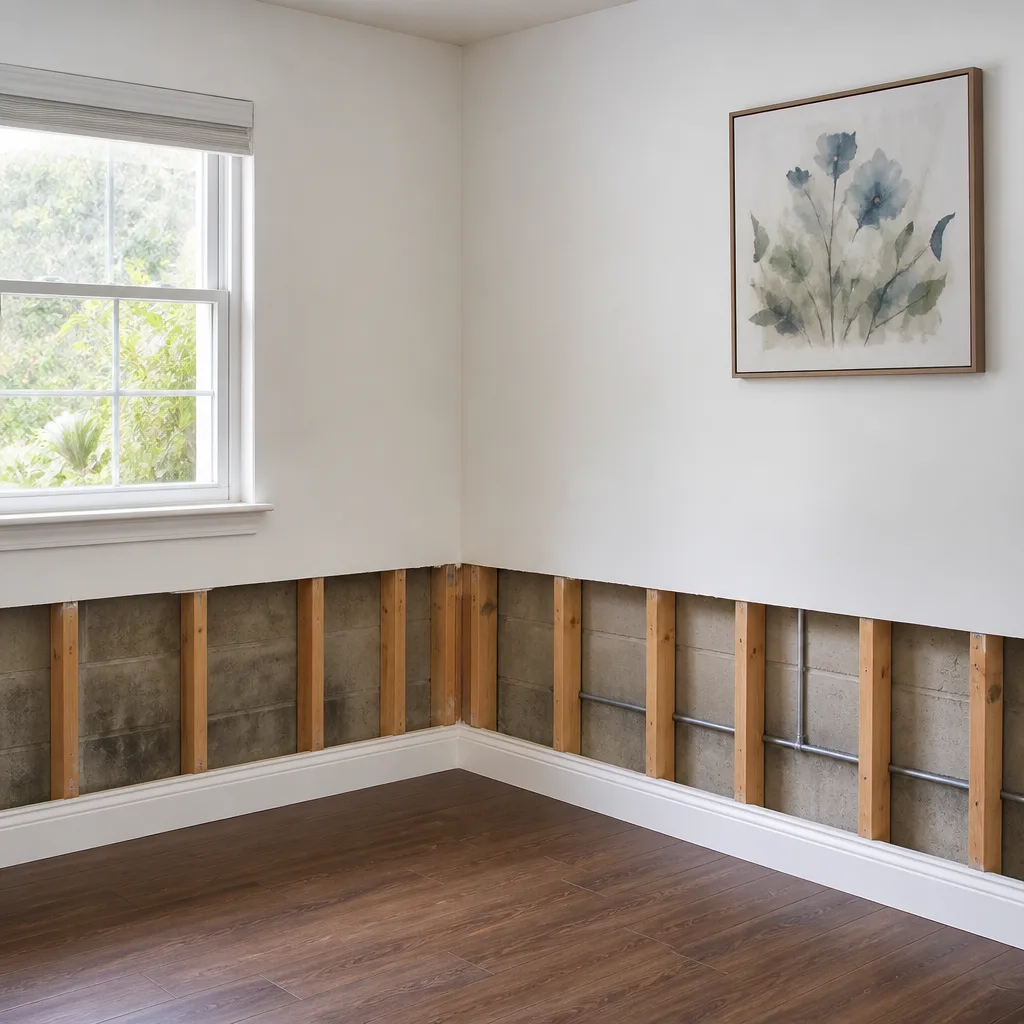


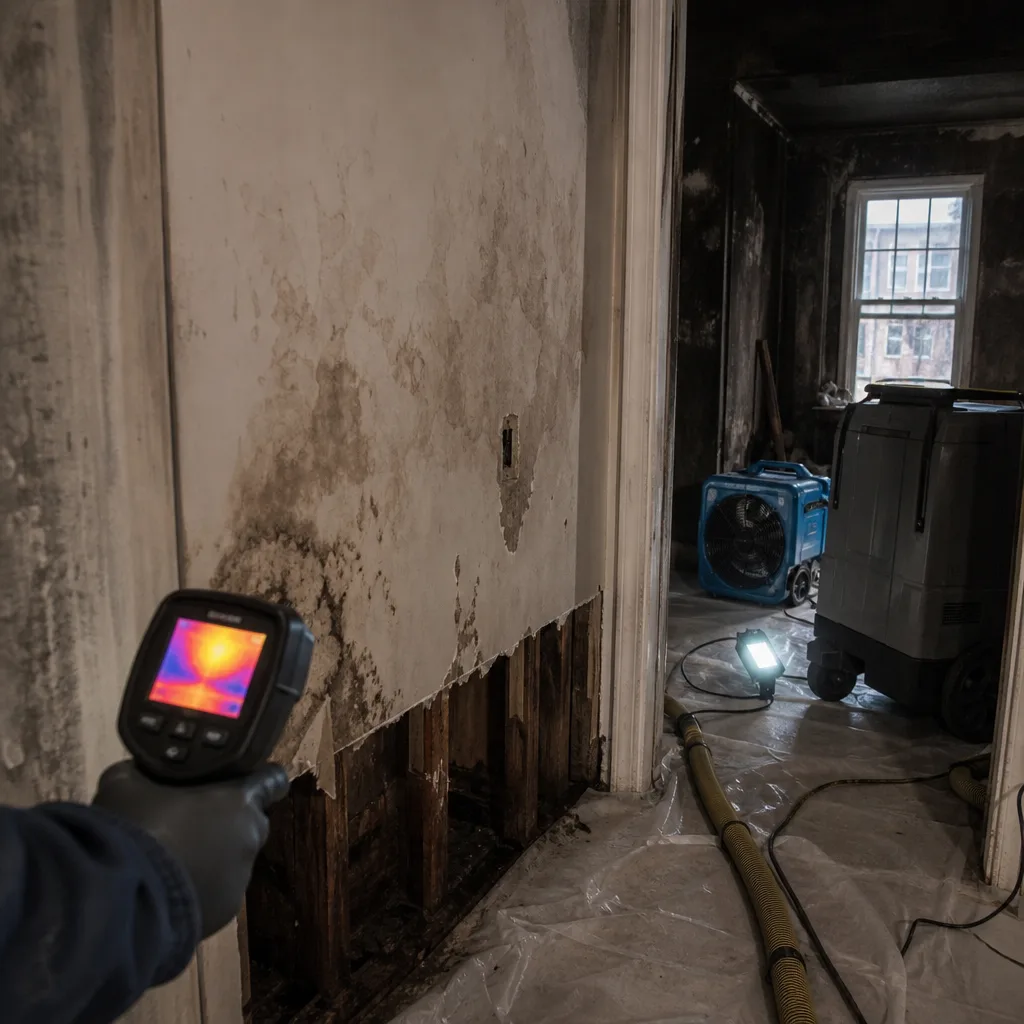 Before
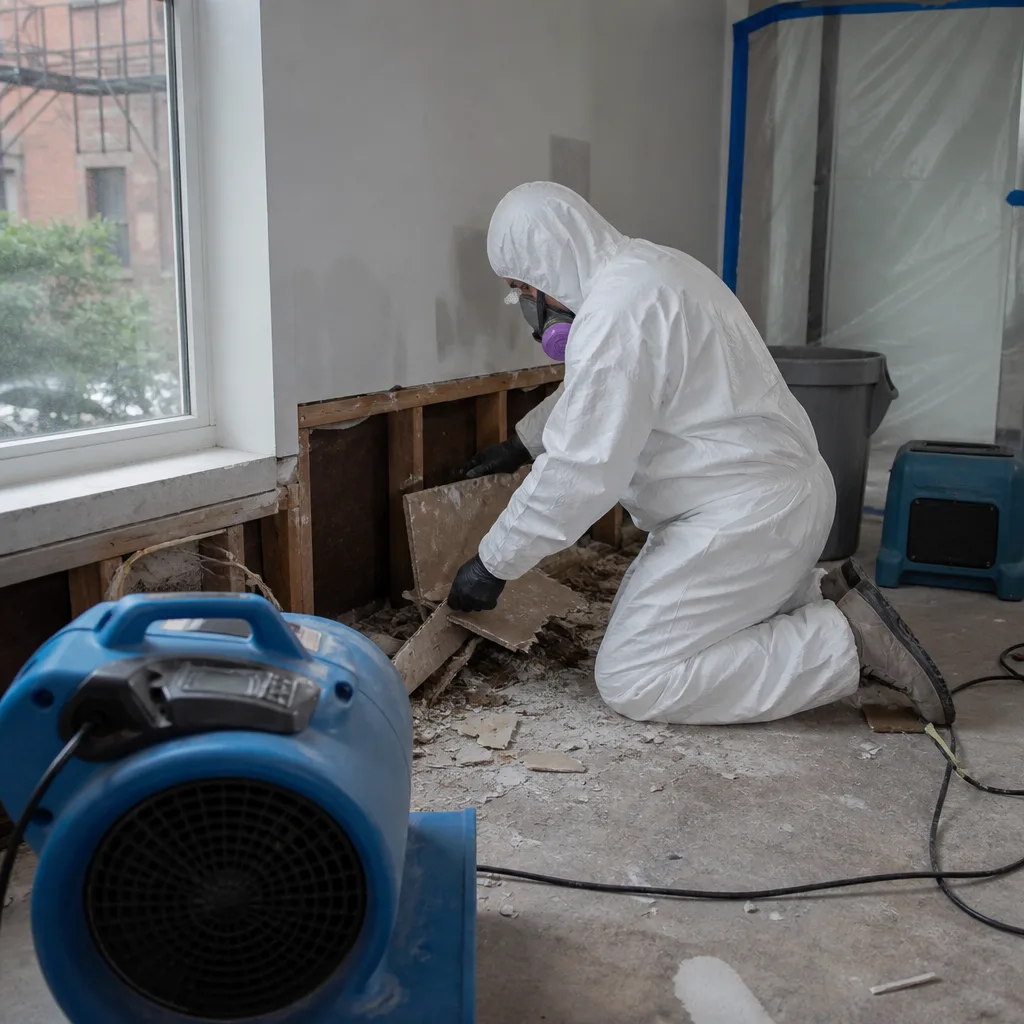 After
After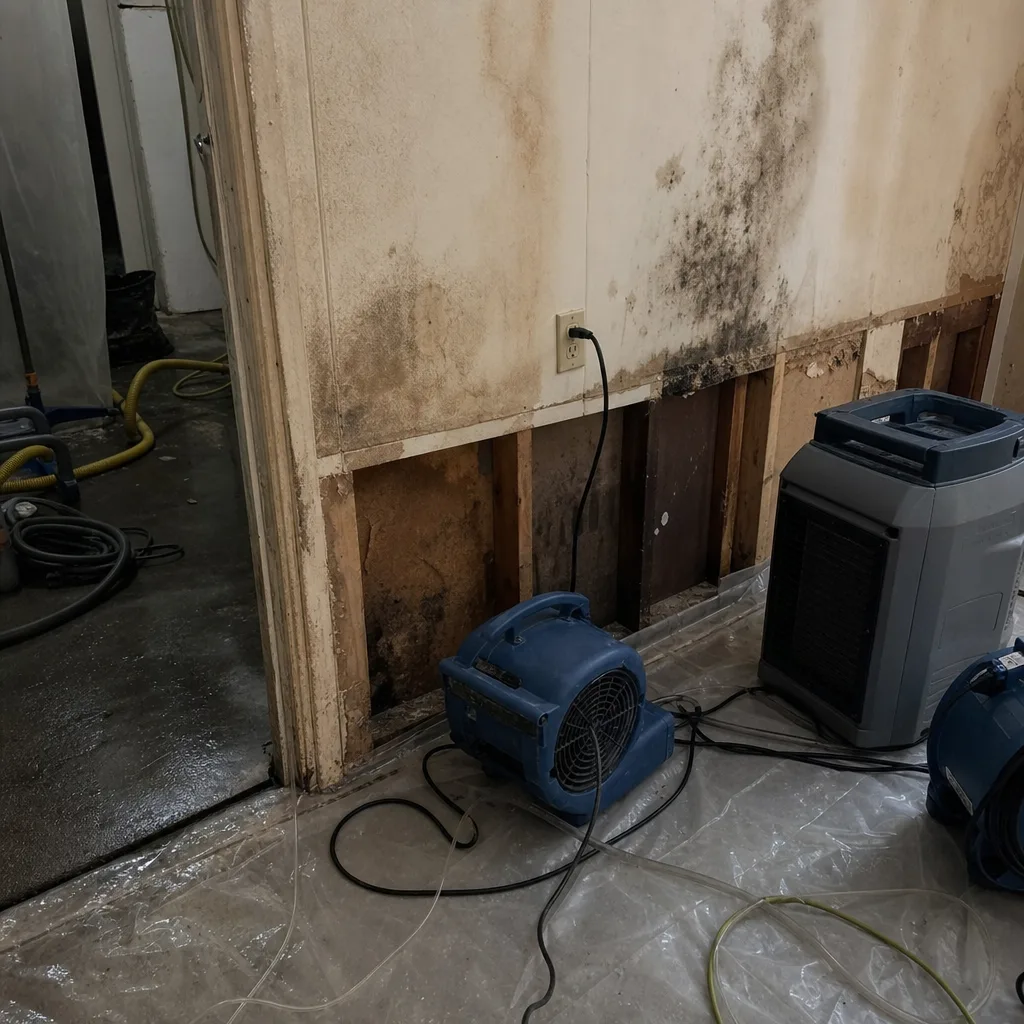 Before
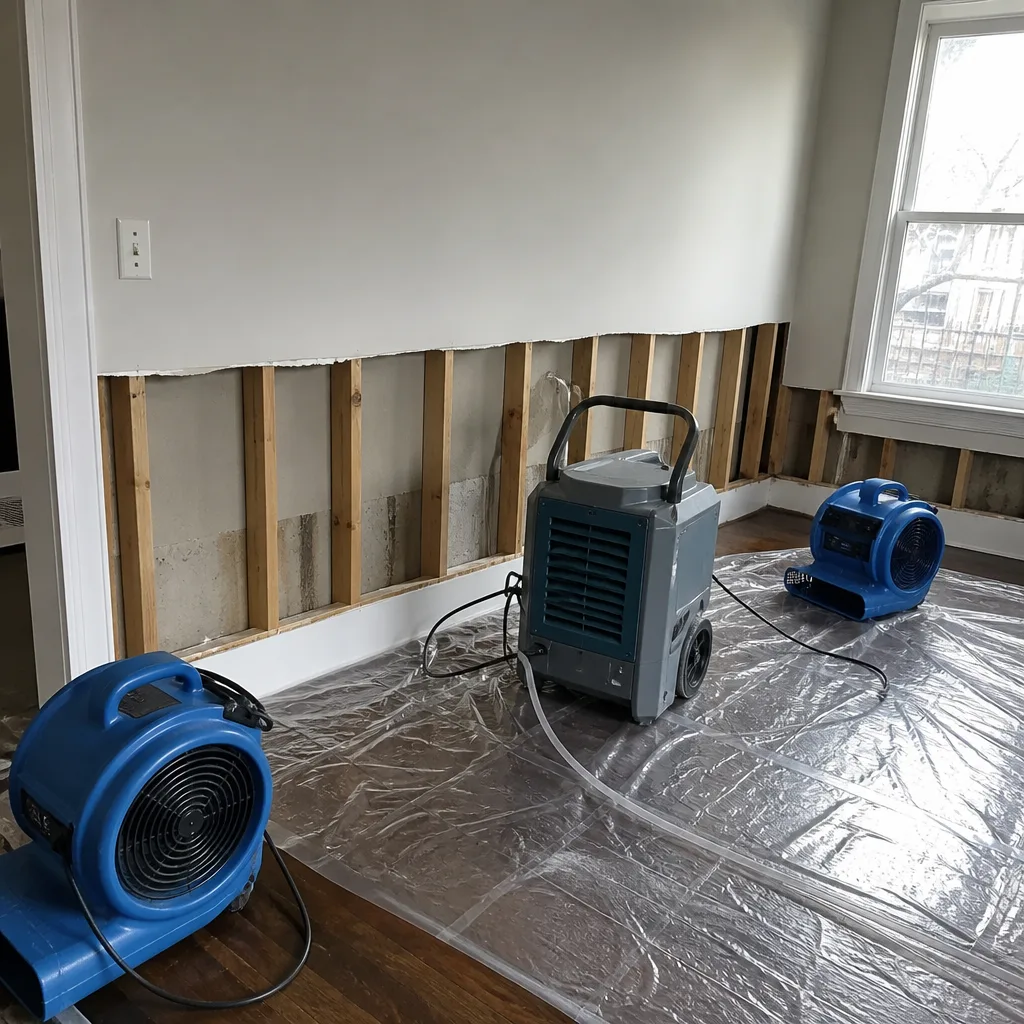 After
After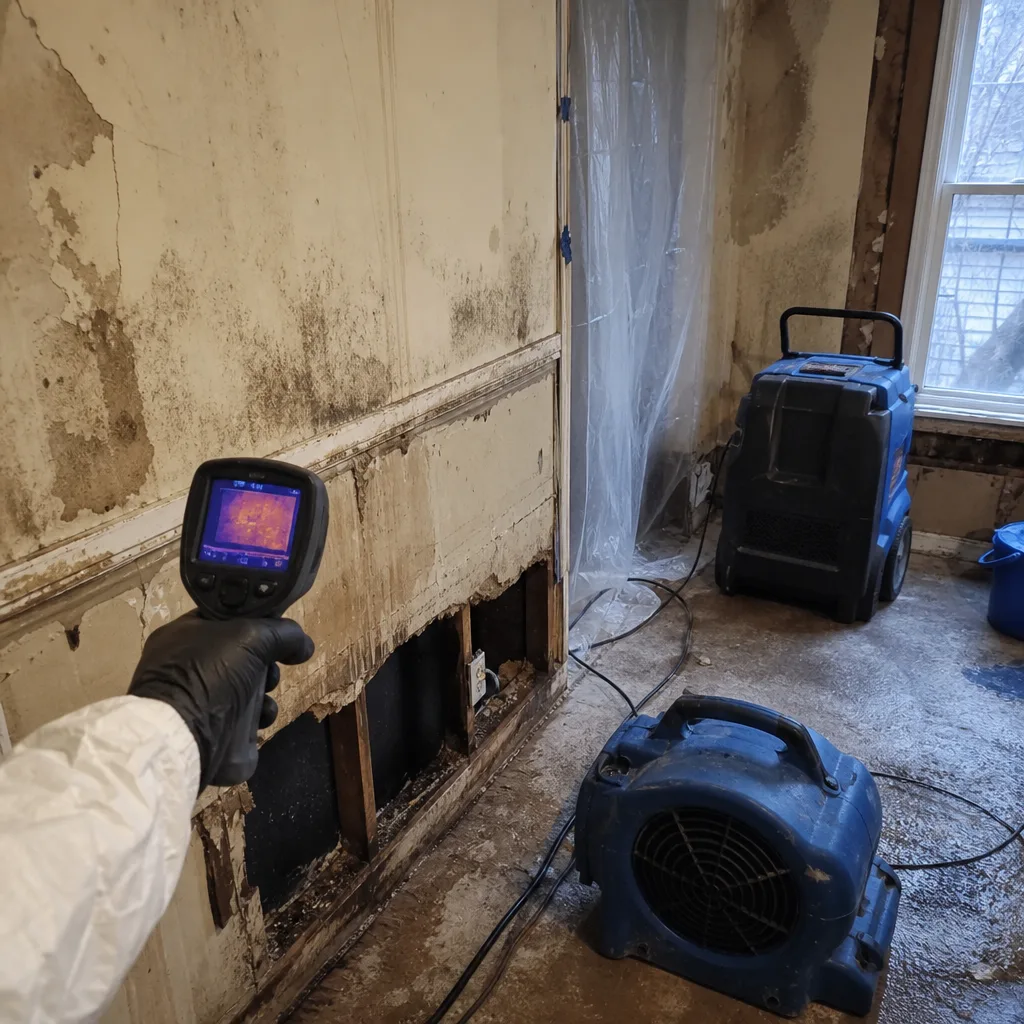 Before
 After
AfterSeasonal Damage Restoration Care for Hoboken: Year-Round Homeowner’s Guide
The week after Hoboken’s first hard freeze is statistically when the most pipe burst claims are filed - not during the freeze itself, but during the thaw when split pipes finally drain into walls. We’ve restored 12,000+ homes since 2011, and the pattern is consistent: homeowners who think they’re safe once temperatures rise are the ones calling us with water pouring through ceiling drywall. This guide - a companion to our Complete Guide to Damage Restoration in Hoboken - maps Hoboken’s four damage-risk windows to specific measurements you can take, not generic seasonal checklists. You’ll learn when to test what, what numbers matter, and how dated photo documentation of your pre-season inspections turns a disputed claim into a paid one.
Quick Answer
Hoboken homeowners should perform four targeted inspection windows annually: late January for freeze-thaw pipe stress, late March for basement moisture post-thaw, mid-July for attic humidity during peak hurricane-season moisture, and mid-October for exterior envelope sealing before nor’easter season. Each window requires a specific measurement - basement moisture reading, attic relative humidity, hose bib pressure test, or thermal image scan - documented with dated photos to establish pre-loss condition for any future insurance claim. For a full breakdown of expected costs, see our Damage Restoration Cost Breakdown: The Hoboken Homeowner’s Reference for 2026.
Table of Contents
- Hoboken’s Four Damage-Risk Windows
- Winter: The Freeze-Thaw Pipe Crisis
- Spring: Basement Moisture and the Hudson River Effect
- Summer: Humidity, Mold, and the Urban Heat Island
- Fall: Nor’easter Prep and the Envelope Test
- The Post-Storm 48-Hour Protocol
- Building Your Seasonal Documentation File
- Common Mistakes to Avoid
- When to Call a Professional
- Frequently Asked Questions
- The Bottom Line
BeforeAfterHoboken’s Four Damage-Risk Windows
Hoboken’s damage risk doesn’t distribute evenly across the calendar. It concentrates in four narrow windows driven by specific meteorological and geographic factors. The Hudson River moderates winter lows but also elevates spring basement humidity. The urban heat island accelerates certain failures while masking others. Understanding these windows lets you inspect once, correctly, rather than constantly.
Window One: Late January (typically January 20-February 5)
This is the deep freeze window, when sustained temperatures below 20°F stress aging copper and galvanized supply lines in Hoboken’s pre-war housing stock. The critical event isn’t the freeze - it’s the thaw that follows, when ice plugs dislodge and water finds the split seam. In our experience, the week after the first hard freeze produces more Hoboken water damage calls than the freeze itself.
Window Two: Late March (typically March 20-April 10)
Spring thaw coincides with Hudson River ice breakup and elevated groundwater. Basements that read dry in February show moisture readings above 15% wood moisture equivalent (WME) by late March. This is when latent winter damage becomes visible.
Window Three: Mid-July (typically July 15-August 5)
Hurricane season humidity peaks, and Hoboken’s urban heat island sustains nighttime temperatures above 75°F. Attics without adequate ventilation reach dew point conditions, creating condensation on sheathing that mimics roof leaks. We see this most in the row house blocks between Washington Street and Willow Avenue, where roof geometries trap air.
Window Four: Mid-October (typically October 10-25)
Nor’easter season preparation window. The first coastal low-pressure systems arrive in November, but October is when sealants are still pliable enough to apply and cure before cold weather. This is your envelope test window.
Winter: The Freeze-Thaw Pipe Crisis
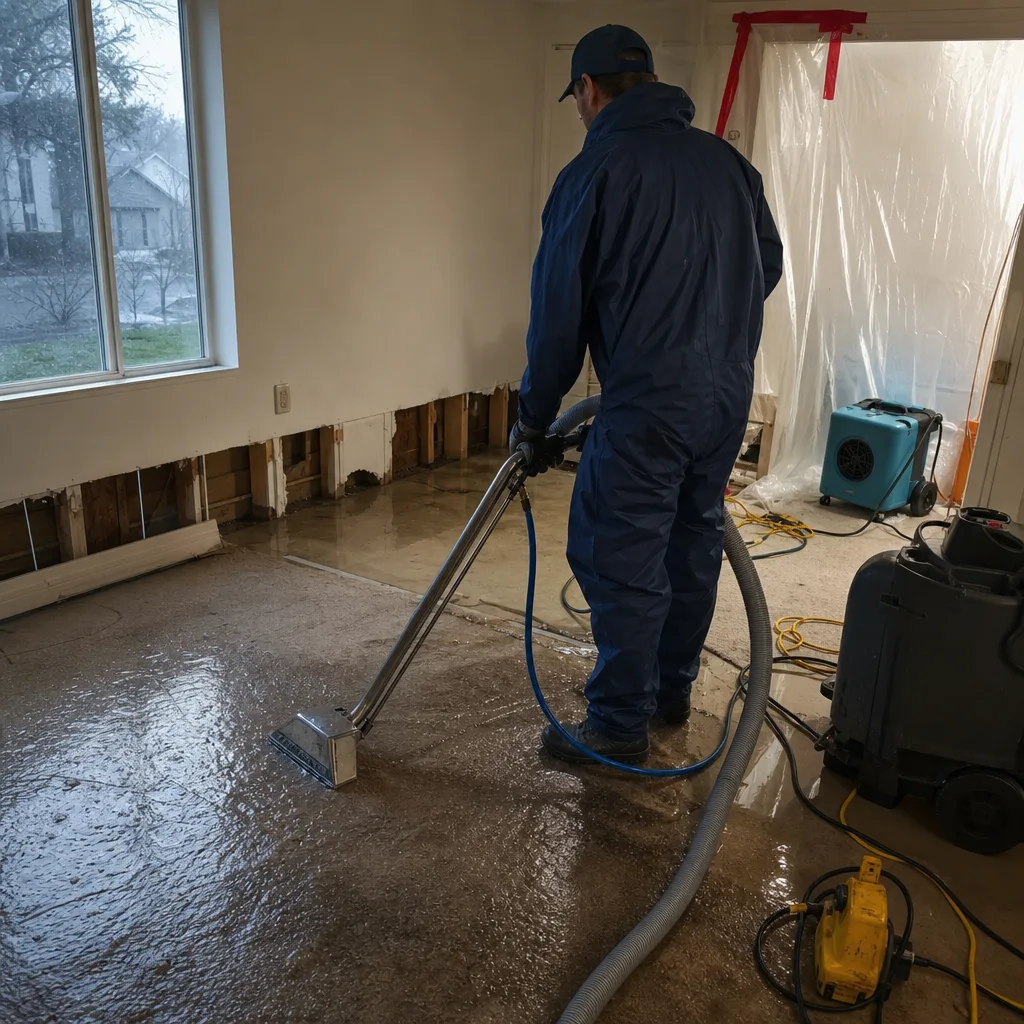
Hoboken’s building stock is uniquely vulnerable to freeze-thaw pipe failure. The city’s pre-war construction - brownstones, walk-ups, and converted industrial lofts - includes uninsulated perimeter walls, exterior kitchen and bath plumbing chases, and aging galvanized supply lines with reduced wall thickness. When temperatures drop below 20°F for more than 24 hours, water in these lines freezes. The ice plug doesn’t burst the pipe; the hydraulic pressure between the ice plug and a closed faucet does.
The counterintuitive part: you won’t know until the thaw. The ice plug acts as a seal. When it melts, water sprays into wall cavities with full municipal pressure - typically 60-80 PSI in Hoboken’s system. By the time you see staining, the cavity has been wet for hours.
What to measure in late January:
- Pipe temperature at exterior walls. Use an infrared thermometer on exposed supply lines where they pass through exterior walls. Any reading below 40°F indicates risk. Document the location and temperature with a dated photo.
- Faucet flow rate at the furthest fixture. A reduction in flow during cold weather suggests partial freezing upstream. Measure flow in gallons per minute (GPM) at the bathroom farthest from your water main. Normal is 2-3 GPM. Below 1.5 GPM warrants investigation.
- Interior wall temperature at plumbing chases. In Hoboken’s typical brownstone, plumbing runs through exterior walls on the north and west exposures. Measure surface temperature at these walls. Below 50°F indicates inadequate insulation or air sealing.
Specific Hoboken vulnerability: Buildings on the east side of Washington Street, closer to the river, experience more wind-driven cold infiltration. We’ve documented pipe bursts in these structures at higher rates than the western blocks, particularly in units above unheated commercial spaces where heat rises but perimeter walls remain cold.
If you find temperatures below threshold, the mitigation is straightforward: open cabinet doors to allow convective heating, let faucets drip at 0.25 GPM to relieve pressure, and add temporary insulation at accessible pipe sections. Document these measures with dated photos. If a burst occurs, your insurer will ask what preventive steps you took.
Spring: Basement Moisture and the Hudson River Effect
Hoboken’s basement moisture problem isn’t rainfall - it’s groundwater elevation driven by Hudson River hydrology. The river’s spring freshet, combined with snowmelt from upstate watersheds, raises the local water table. Basements that were functionally dry in February become damp in March, not because of new leaks but because the hydraulic head pressure exceeds the foundation’s resistance.
We’ve measured this directly. In a typical Hoboken basement at Second and Garden Streets, the slab moisture vapor emission rate (MVER) reads 3-4 lbs/1000 sq ft/24 hours in February. By late March, that same slab reads 8-12 lbs. The concrete hasn’t changed; the pressure differential has.
What to measure in late March:
- Basement relative humidity (RH). Use a calibrated hygrometer at multiple heights: slab level, 4 feet, and ceiling. RH above 60% at any height supports mold growth. RH above 70% indicates active moisture intrusion requiring professional assessment. Document each reading with location, height, and date.
- Wood moisture equivalent (WME) on sill plates and rim joists. Use a pin-type moisture meter. Readings above 16% WME indicate conditions conducive to wood decay fungi. In Hoboken’s balloon-framed structures, these members are often concealed by finished ceilings - test at accessible utility penetrations.
- Floor drain flow rate. Pour 5 gallons of water into each basement floor drain. It should clear in under 30 seconds. Slower drainage suggests sediment accumulation or, worse, backflow from elevated groundwater. A non-draining drain during high water table conditions can force water through slab cracks.
The river proximity effect: Properties within two blocks of the Hudson - roughly east of Hudson Street - experience more pronounced spring moisture elevation. We’ve documented cases where basements at River Street showed standing water while basements at Clinton Street, same block, same building type, remained merely damp. The difference is elevation and distance from the river’s influence, not roof drainage or grading.
If your March readings exceed thresholds, the response depends on source. Elevated RH with normal WME suggests ventilation deficiency; a dehumidifier sized to the space (typically 70-pint capacity for a 1,000 sq ft Hoboken basement) may suffice. Elevated WME indicates liquid water intrusion requiring professional diagnosis of the foundation drainage path. Water damage restoration in Hoboken addresses these cases with documented moisture mapping, not guesswork.
Summer: Humidity, Mold, and the Urban Heat Island
Hoboken’s urban heat island sustains temperatures 5-8°F higher than surrounding suburban areas at night. This matters for moisture because relative humidity is temperature-dependent: warm air holds more moisture, but when that warm air contacts cooler surfaces, the relative humidity at the surface spikes to 100% and condensation forms.
In summer, the critical surface is attic sheathing. Daytime solar heating drives attic temperatures to 140°F+. At night, the sheathing radiates heat and cools below the dew point of the humid air entering through soffit vents. Condensation forms on the underside of sheathing, saturating the wood to levels that support mold growth. Homeowners see water stains and assume roof leaks. Contractors replace shingles unnecessarily. The actual problem is ventilation imbalance combined with humidity load.
Hoboken’s flat roof complication: The city’s brownstone and row house stock features predominantly flat or low-slope roofs, unlike the pitched suburban roofs where standard ventilation formulas were developed. Flat roofs have minimal stack effect to drive natural ventilation. Heat builds at the roof deck. HVAC equipment, common on Hoboken flat roofs, adds radiant heat and sometimes duct leakage that pressurizes the attic space with conditioned, moisture-laden air.
We’ve documented ice dam formation on these flat roofs in winter - a phenomenon most homeowners associate with pitched roofs - caused by heat loss through inadequate roof insulation that melts snow from below, with the meltwater refreezing at the parapet edge. The urban heat island exacerbates this by reducing the cold-period duration that would otherwise maintain snow load.
What to measure in mid-July:
- Attic relative humidity at 10 AM and 10 PM. The diurnal swing tells the story. RH above 70% at either measurement indicates inadequate ventilation or duct leakage. Document both readings with a dated photo of the hygrometer display.
- Sheathing moisture content with a pinless meter. Readings above 12% on plywood, 15% on OSB, indicate moisture accumulation. Test at multiple locations, especially near HVAC penetrations and parapet walls where thermal bridging occurs.
- Temperature differential between attic air and outdoor ambient. At 10 PM, measure both. A differential less than 5°F suggests the attic is too thermally connected to conditioned space (duct leakage, inadequate insulation) or too poorly ventilated to cool. Either condition drives condensation.
Specific Hoboken neighborhood pattern: The blocks between Willow Avenue and Bloomfield Street, with higher concentration of original 1880s construction, show more attic moisture issues than the western blocks with post-1950 construction. The older buildings have minimal insulation, balloon framing that connects attic to wall cavities, and original slate or tin roofs with complex penetration details that resist modern sealing methods.
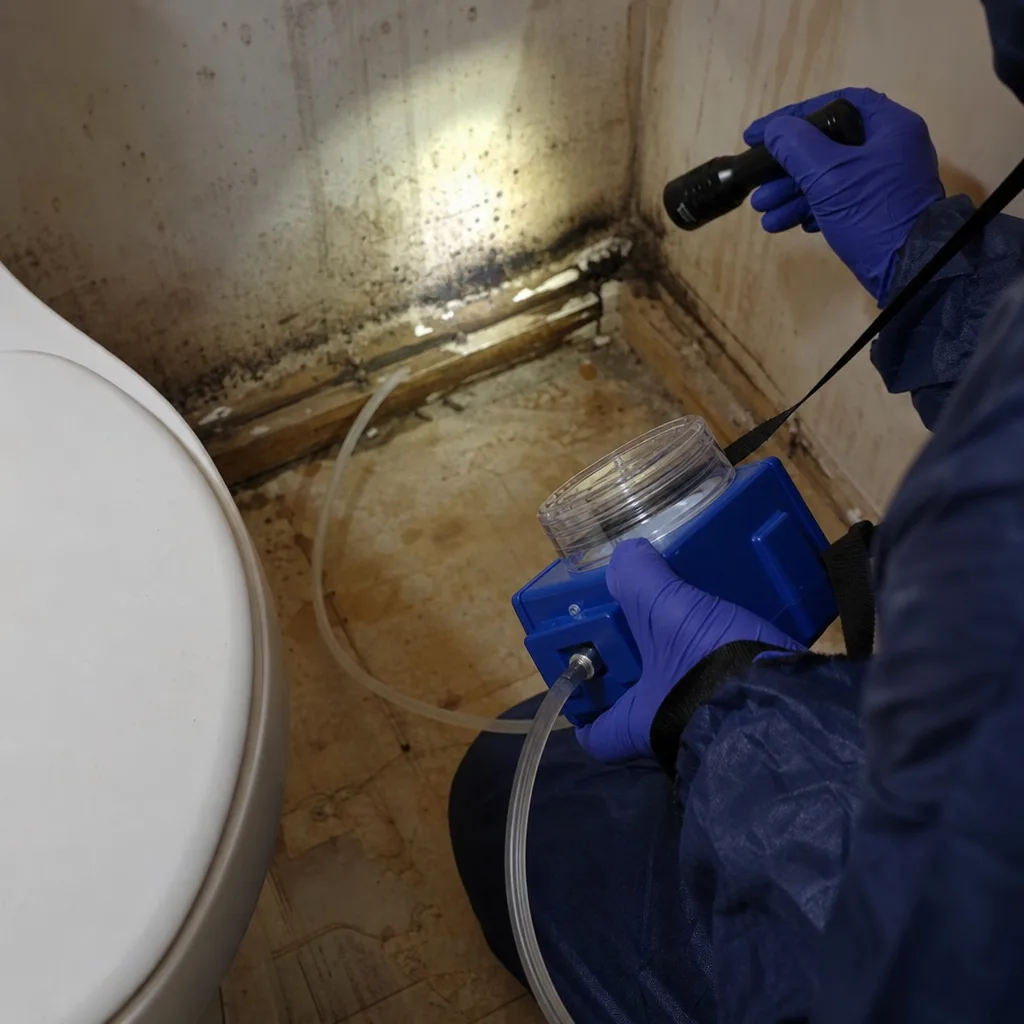
If measurements exceed thresholds, solutions range from adding soffit vent area (if structurally possible on flat roof parapets) to installing powered attic ventilation, to addressing duct leakage with sealed duct systems. Mold remediation in Hoboken becomes necessary when sheathing moisture has persisted long enough to establish fungal growth - typically 48-72 hours above 70% RH with organic substrate.
Fall: Nor’easter Prep and the Envelope Test
Nor’easters are Hoboken’s most destructive weather pattern. The October 2012 event established the benchmark, but lesser systems cause cumulative damage: wind-driven rain through envelope breaches, storm surge backflow through drainage systems, and prolonged power loss that disables sump pumps and dehumidification. The preparation window is narrow - after summer heat degrades sealants, before cold weather prevents their proper curing.
What to measure in mid-October:
- Exterior hose bib pressure test. Attach a pressure gauge to each exterior faucet. Open the valve fully. Pressure should read within 10% of your interior fixture pressure. A significant drop suggests a leaking frost-proof sillcock or, worse, a cracked body that will spray into the wall when the valve is opened against ice blockage. Document each reading.
- Window and door air leakage with a smoke pencil or thermal camera. On a day with 15°F+ temperature differential between inside and outside, scan each opening. Leakage at the header, sill, or jamb indicates failed sealant or improper flashing. In Hoboken’s brick and brownstone construction, the critical failure point is often the interface between wood window frames and masonry - a gap that opens with thermal cycling and admits wind-driven rain directly to the stud cavity.
- Roof drain and scupper flow. Pour water into each roof drain. It should clear without pooling. In flat roof systems common in Hoboken, leaf debris accumulates at the strainer and sump. A blocked drain during a 2-inch-per-hour nor’easter produces roof ponding, structural load, and eventual breach at the weakest membrane seam.
- Sump pump cycle test. Fill the sump pit to the float activation level. The pump should activate, discharge, and return to standby within 2 minutes. Test the backup power system if present. In Hoboken’s low-lying areas, particularly the blocks south of Fourth Street, sump pump failure during storm surge events is the primary cause of basement flooding.
The envelope test protocol: On a windy day, close all windows and doors, activate all exhaust fans and the dryer, and walk the interior with a smoke pencil or your hand at outlets, baseboards, and ceiling fixtures. Inward airflow indicates envelope leakage points that will admit wind-driven rain during a nor’easter. Document each location with a dated photo.
Sealant application in October requires attention to temperature. Most polyurethane sealants require 40°F minimum for 24 hours to cure. Hoboken’s average October low is 50°F, but early October can drop below threshold. Check the 10-day forecast before starting work. Silicone sealants tolerate lower temperatures but have shorter service life on masonry substrates.
The Post-Storm 48-Hour Protocol
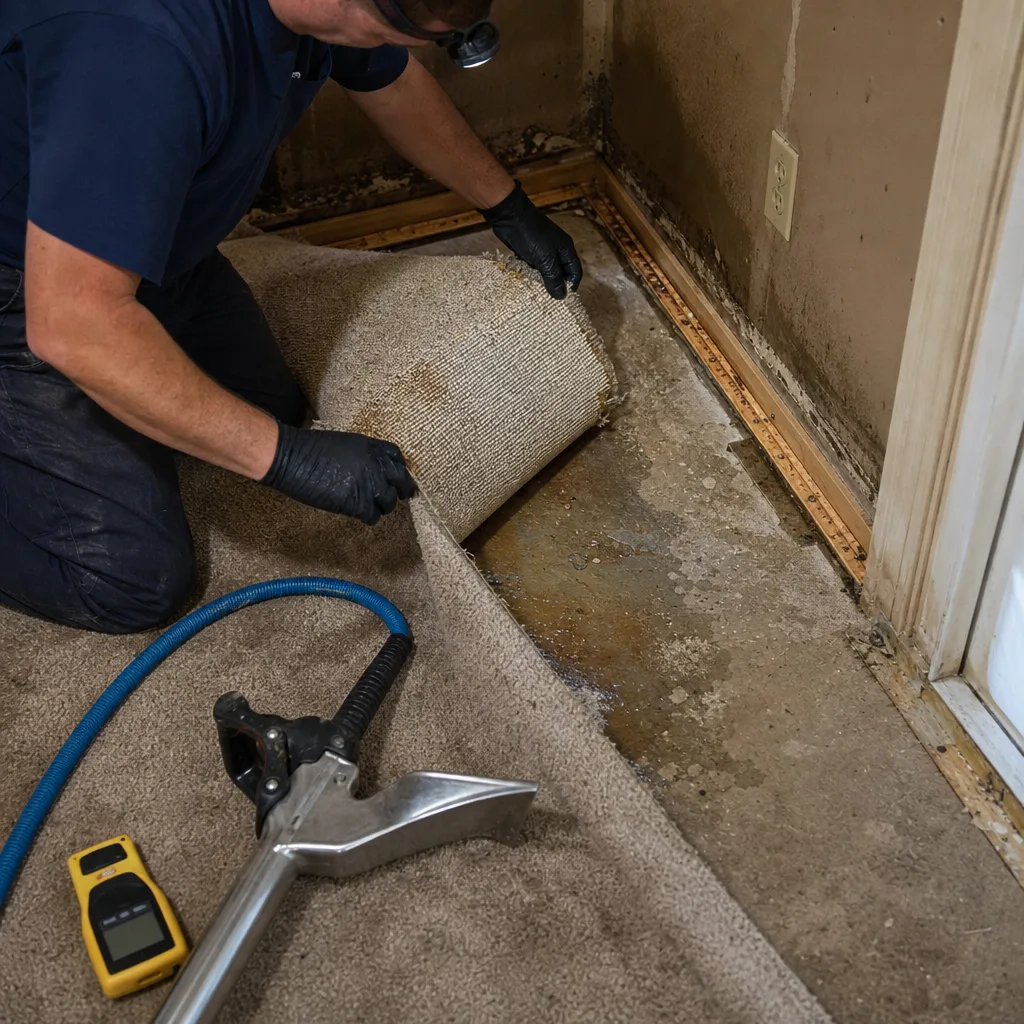
The 48 hours after a nor’easter or tropical system are when damage becomes permanent. Water that could be extracted and dried becomes absorbed into structural materials. Mold that could be prevented establishes growth. And documentation that could support your claim degrades or disappears.
We’ve developed this protocol from 12,000+ restoration projects. It prioritizes documentation before mitigation, because the quality of your claim depends on what you can prove about pre-loss condition and damage progression.
Hour 0-6: Safety and Documentation
- Photograph all visible damage before moving anything. Include wide shots establishing location context and close shots showing damage extent. Enable timestamp on your camera.
- Photograph the exterior conditions that caused the damage: blocked drains, damaged roofing, failed sealant - while they’re still present.
- Record moisture readings at affected materials with a pinless meter if available. Document the reading, location, and time.
- Contact your insurance carrier to establish the claim number and adjuster assignment. Request their documentation requirements.
Hour 6-24: Initial Mitigation
- Remove standing water with available means - wet/dry vacuum, mopping, pumping. Do not use household vacuums not designed for water.
- Remove wet porous materials that are easily replaceable: area rugs, cardboard boxes, upholstered furniture that has absorbed sewage-contaminated water. Bag and photograph before disposal.
- Increase ventilation if outdoor humidity permits (RH below 60%). If outdoor humidity is higher, close windows and run air conditioning or dehumidification.
- Do not disturb visibly moldy materials without respiratory protection. Disturbing mold releases spores; containment requires professional equipment.
Hour 24-48: Professional Assessment
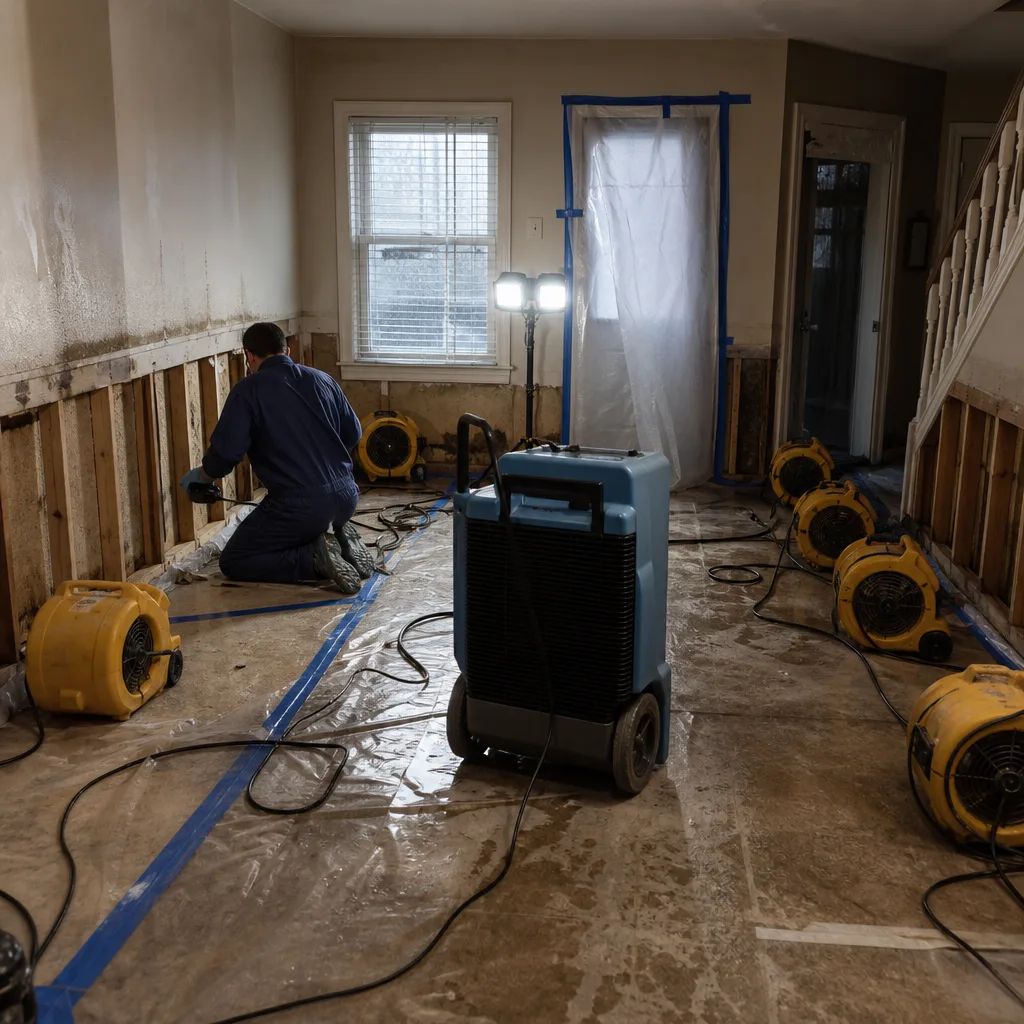
By 48 hours, water has penetrated to the depth where surface drying won’t reach. Structural materials - studs, subfloor, insulation - may read dry at the surface while maintaining elevated moisture content internally. This is when professional moisture mapping with pin-type meters, thermal imaging, and psychrometric calculation becomes essential.
Psychrometric data is the measurement of air properties that determine drying potential: temperature, relative humidity, and vapor pressure. Restoration professionals use this data to calculate the grains of moisture per pound of air, the dew point, and the rate at which dehumidification equipment will remove water from the structure. Without this calculation, drying is guesswork.
Our documentation standard, established under The Haven Standard, requires photo record on every visit, written scope before work begins, and daily drying logs with moisture readings at defined locations. These logs become the evidence that converts restoration invoices into paid claims.
Building Your Seasonal Documentation File
Insurance claims are disputes over facts. The policyholder who can establish pre-loss condition with dated documentation wins disputes. The policyholder who cannot, loses.
Your seasonal inspection record serves this purpose. Each measurement you take, each photo you capture, establishes the condition of your property at a specific time. If a March pipe burst damages your basement, your January documentation showing dry sill plates and normal humidity becomes evidence that the damage was sudden and accidental, not long-term maintenance neglect.
File structure:
- Cover sheet: Property address, insurance policy number, your contact information, and the date range of the file.
- Seasonal sections: Winter (January), Spring (March), Summer (July), Fall (October). Each section contains dated photos, measurement readings, and notes on any maintenance performed.
- Equipment inventory: Photos and serial numbers of sump pumps, dehumidifiers, water heaters, HVAC systems - the equipment whose failure causes damage.
- Maintenance receipts: Roof repairs, sealant applications, plumbing updates, with contractor names and license numbers.
Storage: Keep physical copies in a fireproof container, digital copies in cloud storage with automatic backup, and email a summary to your insurance agent annually. The agent’s acknowledgment email becomes part of your record.
In our experience, the claims that resolve quickly and fully are those where the homeowner produces documentation without being asked. The adjuster’s job is to verify loss and prevent fraud. Your documentation makes verification easy. DryMark Restoration Hoboken home provides this documentation as standard practice, not an upsell.
Common Mistakes to Avoid
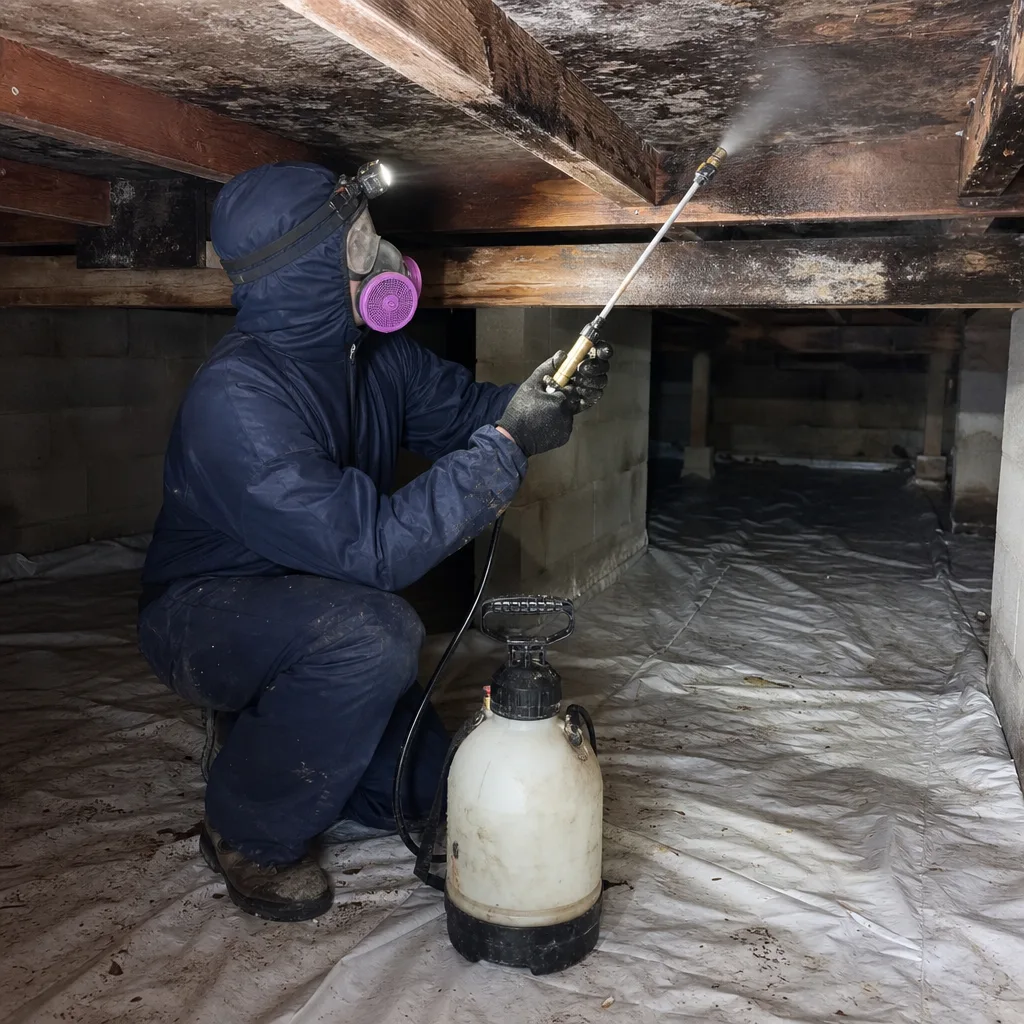
- Measuring only once per season. A single snapshot misses the progression that tells the real story. Measure at the beginning and end of each risk window to establish trend.
- Using uncalibrated instruments. A $15 hardware store hygrometer can drift 10% RH in a year. Calibrate against a salt slurry test (75% RH at 75°F) or replace annually. Document calibration date.
- Ignoring the urban heat island’s winter effect. Hoboken’s elevated nighttime temperatures reduce snow load duration but increase freeze-thaw cycles. Roofs experience more thermal stress than suburban equivalents. Inspect flashing and membrane seams more frequently, not less.
- Documenting without context. A photo of a moisture meter reading is useless without location, material type, date, and ambient conditions. Include a written note or photo of the measurement location.
- Waiting for visible damage before acting. By the time you see staining, the damage is advanced. The measurements in this guide are designed to catch conditions before they become visible.
- Assuming new construction is exempt. Hoboken’s newer buildings, particularly conversions from industrial use, often have complex envelope assemblies with hidden failure points. We’ve documented significant moisture issues in buildings completed within five years.
- Neglecting to update the file after maintenance. The file’s value depends on currency. Schedule updates with your seasonal inspections, not separately.
When to Call a Professional
Call a restoration professional when measurements exceed thresholds you cannot address with homeowner-level intervention, when damage involves contaminated water (sewage, groundwater, fire suppression), when mold is visible or suspected, or when the affected area exceeds what you can dry with household equipment.
Specific scenarios requiring professional response: moisture readings above 20% WME on structural wood, relative humidity above 70% that persists despite dehumidification, visible mold growth exceeding 10 square feet, any water damage involving electrical systems, and any odor indicating microbial growth.
DryMark Restoration Hoboken offers free estimates in Hoboken. Our assessment includes documented moisture readings, thermal imaging, and a written scope with price before any work begins - Haven Standard, Clause 1. Call (551) 212-1580 to schedule. For fire and smoke damage, fire & smoke damage restoration in Hoboken follows the same documentation protocol.
Frequently Asked Questions
A complete DIY monitoring setup - calibrated hygrometer, pinless moisture meter, infrared thermometer, and smoke pencil - costs $200-$400 and lasts 5+ years with proper calibration. Professional seasonal inspection and documentation by a restoration contractor typically runs $150-$300 per visit, with package rates for quarterly service. The cost of documented prevention is minor compared to the average Hoboken water damage claim, which ranges $5,000-$15,000 for basement flooding and $10,000-$40,000 for whole-unit pipe bursts. Call (551) 212-1580 for exact pricing on inspection packages - estimates are free.
Insurance covers sudden and accidental damage, not gradual deterioration or maintenance neglect. If you can produce dated documentation showing you monitored conditions and addressed findings, you strengthen your position that the damage was sudden. Without documentation, the insurer may attribute damage to long-term neglect and deny or reduce the claim. The seasonal file described in this guide exists to prevent this dispute.
Live person answers every call, 24 hours a day, 7 days a week - no voicemail trees, no next-business-day callbacks while water is still moving. Emergency dispatch for water damage, fire damage, and biohazard situations aims for on-site arrival within 90 minutes in Hoboken. Reconstruction and non-emergency services are scheduled and scoped in writing, not dispatched for same-day arrival. Call (551) 212-1580 at any hour.
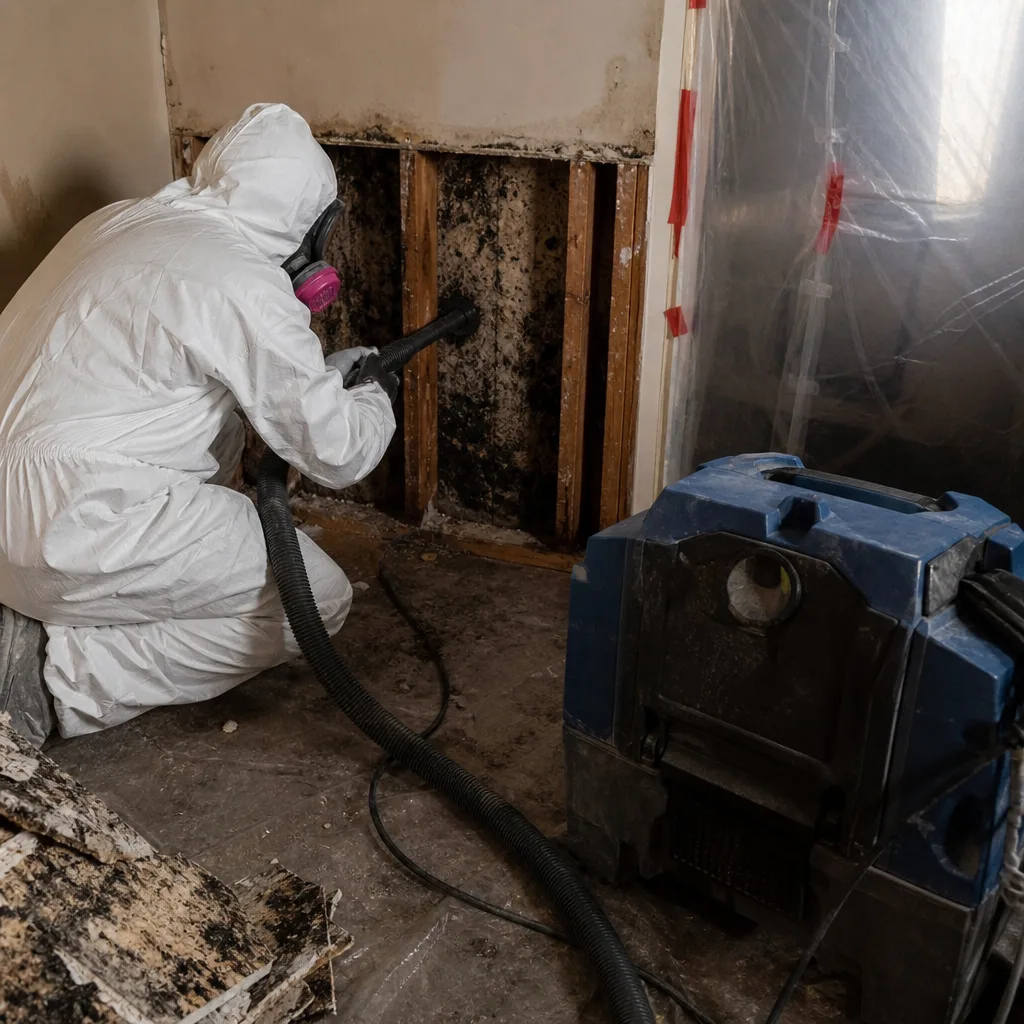
Visible mold growth exceeding 10 square feet, or any mold growth in HVAC systems, requires professional remediation per IICRC S520 standards. Surface cleaning with household products on smaller, non-porous areas may suffice if the moisture source is definitively corrected and verified with post-remediation moisture readings. The risk of inadequate remediation is cross-contamination: disturbed spores migrate through the building and establish new growth in hidden locations. Professional containment with negative air pressure and HEPA filtration prevents this. We offer free second opinions on any competitor’s written mold estimate.
We coordinate directly with your adjuster, providing the documented photo record, daily drying logs, and written scope that adjusters need to approve claims. Our documentation is formatted to insurance industry standards because our founder built this company from claims adjuster experience. We do not ask you to mediate between us and your carrier. The Haven Standard requires transparent documentation that serves all parties.
Hoboken’s varying flood zones - from Zone X (minimal risk) to Zone AE (high risk) - determine insurance requirements but not actual risk during extreme events. The 2012 storm exceeded all zone boundaries. Every property in Hoboken benefits from the October envelope test and sump pump verification described in this guide, regardless of mapped zone. Flood insurance through the NFIP or private market is a separate consideration from standard homeowner’s coverage; verify your policy’s flood provisions independently.
The Bottom Line
Hoboken’s damage risk concentrates in four windows, each with a specific measurement that predicts failure before it becomes visible. The homeowner who documents these measurements seasonally builds a claim file that converts disputed losses into paid ones. The investment is modest: a few hours four times yearly, $200-$400 in monitoring equipment, and the discipline to record rather than assume. The return is measured in claim approvals, avoided mold remediation, and the confidence that your property’s condition is known, not guessed. For professional assessment, documented restoration, or a free second opinion on any written estimate, contact DryMark Restoration Hoboken, and explore more guides & resources on protecting your property.
Written by Alicia Brennan, Owner at DryMark Restoration Hoboken, serving Hoboken since 2011.